Email Marketing Benchmarks: What Matters (And What Doesn't)

-
- The Smart Way to Use Email Marketing Benchmarks
- 9 Email Marketing Metrics + the Benchmarks that Matter
- Top Email Benchmarks By Industry
- Case Study: When Lower Metrics Lead to Higher Success
- Complex Metrics Made Simple
- Build Your Own Benchmarks
- Relationships Beat Email Marketing Benchmarks
- FAQs about Email Marketing Benchmarks
I’ve been running email campaigns for seven years. Product launches, educational series, engagement campaigns for passive subscribers, you name it. And I’m here to tell you something that might surprise you: email marketing benchmarks don’t always tell the whole story.
Not because the numbers are wrong. They’re not. But because they’re missing the context that actually matters.
Think of email marketing benchmarks as helpful guidelines rather than strict rules. Understanding when to pay attention to industry standards and when to trust your own data can transform your email marketing from stressful to strategic.
Let’s dive into what really matters for your email success—and what you can simply stop worrying about.
Get Your Free Email Marketing Benchmark Tracker Track performance. Set goals. Optimize results.
Google reCAPTCHA used. Privacy Policy and Terms of Service apply![]()
The Smart Way to Use Email Marketing Benchmarks
Email marketing benchmarks serve an important purpose: they give you context. When you’re just starting out or launching a new campaign, it’s normal to wonder if a 25% open rate deserves high fives or if it’s just plain concerning. Industry benchmarks help answer that question.
Most marketing emails will see open rates between 20-30%, with click-through rates typically ranging from 3-5%. But these email marketing benchmarks vary significantly based on industry, audience size, and email frequency.
So you shouldn’t panic if your open rate is “below industry average.” You should focus on what actually matters for you. For example, an email newsletter with a 42% open rate might generate only three sales, while promotional emails with no higher than a 28% open rate bring in 15 times more. Which campaign is more successful? The math is obvious, isn’t it?
What the Numbers Actually Tell You
When you realize how much revenue a well-executed email strategy can generate compared to its cost, it’s clear why so many businesses prioritize it. But the real value lies in understanding what makes it so effective.
Companies seeing the highest returns, share some common traits:
- They dedicate substantial resources to email
- They send emails consistently
- They use segmentation to target their messages
- They measure revenue per email, not just vanity metrics like open rates
The takeaway here is that it’s not about hitting a magic number. It’s about understanding the relationship between investment, strategy, and results. And that’s where metrics come, and especially understanding which benchmarks you should really pay attention to.
9 Email Marketing Metrics + the Benchmarks that Matter
1. Open Rate
Formula: (number of opens / number of delivered emails) x 100
Let’s start with a metric that can easily get more attention than it probably should: the open rate. Quite simply, it represents the percentage of email recipients who actually opened your email.
But here’s the thing: open rates just aren’t as reliable as they used to be. Thanks to Apple’s Mail Privacy Protection and security bots from Gmail and Yahoo, many opens are now false or inflated. That doesn’t make them useless—they’re still helpful for spotting deliverability issues and comparing subject line performance—but they’re no longer the gold standard.
- Good Open Rate: 20-30% (varies significantly by industry)
- Red flag: Below 15% or sudden drops of more than 10% points from your normal performance
Now, instead of obsessing over potentially inflated open rates, successful email marketers focus on metrics that show real engagement. Let’s move on to those metrics that reveal the most.
2. Click-Through Rate (CTR)
Formula: (clicks / delivered emails) x 100
This metric shows actual engagement, as it tells you what percentage of people clicked on a link in your email after receiving it. And while bots could inflate clicks, it’s not as excessive as with open rates. This is one of the metrics that best measures campaign effectiveness.
- Good CTR: 2-5% (varies significantly by industry)
- Excellent CTR: 5%+
- Red flag: Below 1%
3. Click-to-Open Rate (CTOR)
Formula: (clicks / opens) x 100
This metric shows how effective your email content is at driving clicks after someone opens the email—in other words, it reflects the percentage of true email engagement with your content. It’s one of the best indicators of whether your email delivers on the promise made by your subject line. A high click-to-open rate means you set the right expectations from the start, and that you followed through.
- Good CTOR: 10-15%
- Excellent CTOR: 20%+
- Industry leaders: Professional Services (27%), Consulting (26.5%)
4. Conversion Rate
Formula: (conversions / delivered emails) x 100
Did your email achieve its goal? Maybe your goal was to make a sale, encourage a download, or get someone to sign up—each email can have its own goal, and it can be whatever objective you choose. At the end of the day, it’s the metric that truly matters for your business.
- Typical range: 2-5% (highly dependent on industry and goal)
5. Revenue Per Email
Formula: (revenue generated / emails sent)
This is the metric that pays the bills—the one that justifies your entire email program. After all, it shows how much revenue your emails generate, directly connecting your email efforts to the bottom line of your marketing funnel.
- Ecommerce average: $0.10 – $0.50 per email
- SaaS average: $0.20 – $1.00 per email
- Strong performance: $1.00+ per email
Having reviewed all the metrics thus far, it’s important to keep in mind that the above benchmarks vary dramatically by industry, product price, and audience size. And while engagement metrics—like the ones we’ve just covered—can be debated, deliverability benchmarks are non-negotiable. These are the foundation of any successful email program. So let’s move on to the deliverability benchmarks you must keep an eye on.
6. Delivery Rate
Formula: (delivered emails / total emails sent) x 100
This metric measures email deliverability via percentage of emails that are successfully delivered to recipients’ inboxes (not bounced or blocked). It’s the foundation of email performance because if your emails aren’t being delivered, nothing else matters. A strong delivery rate signals healthy list hygiene and good sender reputation.
- Aim for 98% or higher

7. Bounce Rate
Formula: (bounced emails / total emails sent) x 100
The bounce rate represents the percentage of emails that couldn’t be delivered to recipients—either because the address is invalid (hard bounce) or there’s a temporary issue (soft bounce). A low bounce rate is a good indicator of email list quality, whereas a high one can damage your sender reputation with inbox providers, making it harder for future emails to land in the inbox.
- Keep it under 2%
8. Spam Complaint Rate
Formula: (spam complaints / delivered emails) x 100
When recipients mark your email as spam, it signals to inbox providers that your messages may be unwanted. Even a small number of complaints can harm your sender reputation and drastically reduce deliverability. ISPs take this metric seriously—consistently high rates can land your emails in the spam folder or block them altogether.
- Stay within 0.1-0.2%
9. Unsubscribe Rate
Formula: (unsubscribes / delivered emails) x 100
When someone chooses to stop receiving your emails, it’s recorded as an unsubscribe. While it might feel like a loss, it’s actually a sign that your list is getting more focused—and that’s a good thing. Unsubscribes are far less harmful than spam complaints, and making it easy for people to opt out shows respect for your audience and supports long-term deliverability.
- A rate between 1–2% is typical
Pro tip: Want to reduce your bounce rate and number of unsubscribes? Add a double opt-in to your sign up process, as it ensures the people who sign up genuinely want to be on your list.
Top Email Benchmarks By Industry
Now that we know the statistics that actually matter, here’s what typical email marketing benchmarks look like, according to DotDigital’s Global Benchmark Report 2025.
These email marketing benchmarks by industry represent comprehensive email marketing statistics from real campaigns, showing how average email open rates and click rates vary significantly across sectors.
Average Performance:
- Unique Open Rate: 32.8%
- Unique Click Rate: 1.3%
- Unique CTOR: 4%
- Unsubscribe Rate: 0.13%
- Bounce Rate: 0.73%
- Delivery Rate: 99.28%
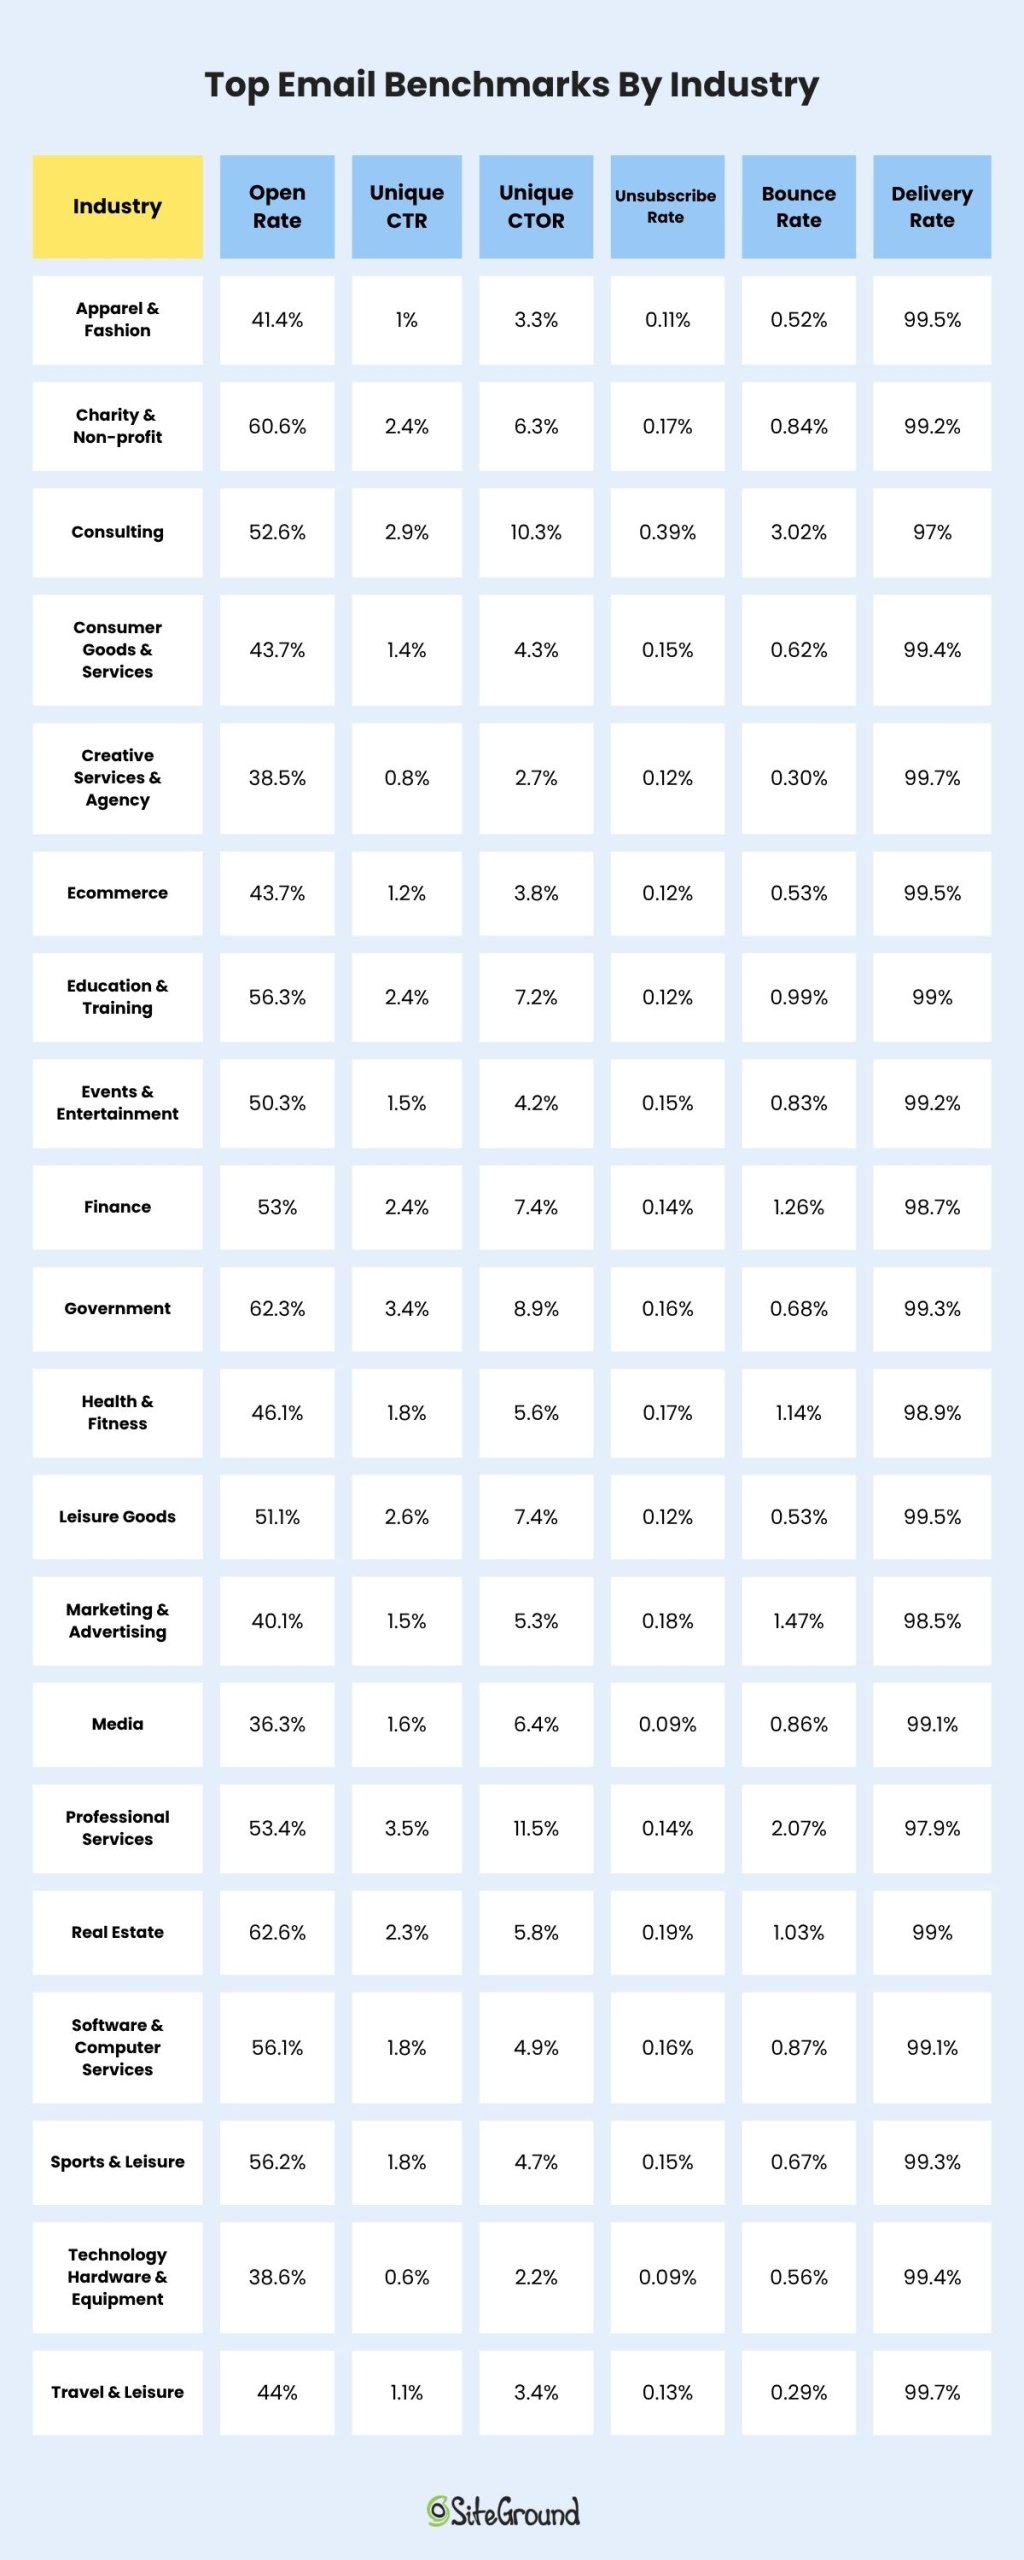
You can see the full list here.
But there’s a lot these numbers don’t tell you. The benchmarks above lack context about audience size, demographics, send frequency, email client (Gmail, Apple, Yahoo, Outlook, etc.) breakdown, or content type. Your specific situation might be completely different.
Case Study: When Lower Metrics Lead to Higher Success
Here’s a case study that might surprise you. In the near past, our team created a four-day email course, called “Grow Your Business Online,” which educated subscribers on practical marketing tactics like content audits, SEO optimization, landing page creation, and email marketing fundamentals. Each day of the course delivered pure value with actionable steps and checklists.
The course had only a small hosting banner at the bottom of each email. No hard sell. No pushy CTAs. Just valuable education with a subtle mention of our services.
The results? Click rates were lower than our sales emails. But the course subscribers became our highest-converting customers. Why? Because we built trust through consistent value delivery. When they needed hosting, we were the obvious choice.
The lesson: relationship-building emails might underperform on immediate metrics but overperform on lifetime value. Sometimes the best sales strategy is not selling at all.
Not sure where you are in the relationship-building process with your customers? Pay special attention to the email customer journey. Sometimes customers might be in an educational stage, while others are more likely on the brink of decision. Knowing this can also change the lens through which you evaluate your metrics.
Complex Metrics Made Simple
You don’t need to constantly compare against industry standard email open rates or get overwhelmed by email marketing statistics. You also don’t need a mathematics degree to track what matters.
Here are some basic email marketing metrics and approaches that you can easily start with. Ask these questions below and find the answers in the metrics:
For every campaign:
- Did people engage? Check CTR.
- Did we deliver on our promise? Check CTOR.
- Did we achieve our goal? Check conversions.
Review monthly:
- Are we reaching inboxes? Check delivery rate.
- Is our list healthy? Check bounce rate.
- Are people happy? Check unsubscribe and spam rates.
Evaluate quarterly:
- What’s our revenue per email?
- Which segments perform best?
- What content drives action?
While email marketing benchmarks by industry provide useful context, your email performance metrics should be measured against your own baseline rather than just average email open rates across your sector.
Build Your Own Benchmarks
Experienced email marketers build their own benchmarks, but honestly anyone can do it. Below, I’m summarizing in four steps how you can easily build your own email marketing benchmarks:
- Establish YOUR baseline: Track your metrics for 3-6 months without major changes
- Separate by type of email: Educational emails perform differently than promotional ones
- Note your patterns: Understand your audience’s unique behavior
- Improve gradually: Aim to beat your own records, not industry averages
Once you know your normal performance, you can run meaningful tests and actually know if they worked.
An Action Plan To Begin With
In order to move beyond the benchmark expectations, I suggest you follow the below roadmap. This action plan has proven successful for me in every email marketing project I’ve worked on.
Week 1-2: Audit Your Current State
- Check your deliverability metrics first (they’re fundamental)
- Note your current CTR and conversion rates
- Don’t change anything yet, just observe
Week 3-4: Pick One Metric to Improve
- Start with CTR (it’s easiest to impact)
- Test one element per email only: subject lines, send times, or CTAs
- Compare to YOUR own baseline, not industry standards
Month 2: Scale What Works
- Continue with the changes that were successful
- Begin basic segmentation (engaged vs. unengaged is a great start)
- Keep tracking against your own benchmarks
Ongoing: Build Relationships, Not Just Lists
- Focus on value-first content
- Make unsubscribing easy
- Remember that trust drives long-term results
Relationships Beat Email Marketing Benchmarks
What really matters in email marketing is building genuine connections with your subscribers, providing value, and always respecting their inbox.
A 22% open rate that builds trust and drives revenue beats a 40% open rate achieved through misleading subject lines—every single time.
And try to remember:
- Open rates are inflated and are getting less reliable
- CTR shows real engagement
- Your best benchmark is your own past performance
- Deliverability metrics are non-negotiable
- Strategies that prioritize value for your subscribers always win long-term
The most successful email marketers I know barely talk about industry benchmarks. They talk about their subscribers, their content strategy, and their continuous improvements.
Great email marketing really happens not by chasing someone else’s average, but by consistently delivering value to the people who chose to hear from you.
After all, behind every click is a real person who trusted you with their inbox. Honor that trust, and the metrics will follow.

FAQs about Email Marketing Benchmarks
What are average email open rates by industry?
Average email open rates vary significantly by industry. Nonprofits see around 40% open rates, while ecommerce averages 30%. Education and training industries typically achieve 35-36% open rates, and business & finance sectors average 31%. These email marketing benchmarks by industry provide context, but your specific audience behavior matters more than hitting these averages.
What is a good click-through rate for email marketing?
A good click-through rate typically ranges from 2% to 5%, but this can vary depending on the industry and the type of content being sent.
How can I improve my email open rates?
Use compelling email subject lines with personalization, test different variations through A/B testing, and send emails at optimal times based on your audience’s behavior.
How do privacy changes impact email marketing metrics?
With enhanced email privacy features, open rate accuracy can be affected. It’s important to adapt your strategies and focus on other metrics like CTR and CTOR for a comprehensive view.
What email marketing metrics should I track instead of just open rates?
Focus on metrics that show real engagement: Click-through rate (CTR), click-to-open rate (CTOR), conversion rate, and revenue per email. These email performance metrics provide more reliable insights than open rates, which can be inflated by privacy features and email bots.
How often should I compare my metrics to email marketing benchmarks?
Check email marketing benchmarks by industry quarterly for context, but track your own performance monthly. Your email marketing statistics should improve against your own baseline rather than constantly chasing industry standard email open rates. Build your own benchmarks based on 3-6 months of consistent data.


Comments ( 0 )
Thanks! Your comment will be held for moderation and will be shortly published, if it is related to this blog article. Comments for support inquiries or issues will not be published, if you have such please report it through our official channels of communication.
Leave a comment
Thanks! Your comment will be held for moderation and will be shortly published, if it is related to this blog article. Comments for support inquiries or issues will not be published, if you have such please report it through our official channels of communication.